Code show/hide
# Fit a full 6 predictor model in n544
options(prType='html')
html(describe(n544), scroll=TRUE)11 Variables 544 Observations
Teratoma
| n | missing | distinct | Info | Sum | Mean | Gmd |
|---|---|---|---|---|---|---|
| 544 | 0 | 2 | 0.746 | 252 | 0.4632 | 0.4982 |
Pre.AFP
| n | missing | distinct | Info | Sum | Mean | Gmd |
|---|---|---|---|---|---|---|
| 544 | 0 | 2 | 0.675 | 186 | 0.3419 | 0.4508 |
Pre.HCG
| n | missing | distinct | Info | Sum | Mean | Gmd |
|---|---|---|---|---|---|---|
| 544 | 0 | 2 | 0.704 | 205 | 0.3768 | 0.4705 |
Pre.lnLDH
        n  missing distinct     Info     Mean      Gmd      .05      .10      .25
      544        0      472        1   0.4582   0.7327 -0.38735 -0.26645 -0.03266
      .50      .75      .90      .95
  0.31299  0.92886  1.33528  1.65328
| lowest : | -1.06582 | -0.948039 | -0.766913 | -0.731368 | -0.564972 |
| highest: | 2.42812 | 2.44938 | 2.48708 | 2.6237 | 2.76577 |
sqpost
| n | missing | distinct | Info | Mean | Gmd | .05 | .10 | .25 | .50 | .75 | .90 | .95 |
|---|---|---|---|---|---|---|---|---|---|---|---|---|
| 544 | 0 | 93 | 0.996 | 5.133 | 2.922 | 1.414 | 2.236 | 3.162 | 4.472 | 6.652 | 9.669 | 10.000 |
reduc10
| n | missing | distinct | Info | Mean | Gmd | .05 | .10 | .25 | .50 | .75 | .90 | .95 |
|---|---|---|---|---|---|---|---|---|---|---|---|---|
| 544 | 0 | 200 | 0.998 | 4.482 | 4.307 | -2.500 | 0.000 | 2.000 | 5.167 | 7.337 | 8.785 | 10.000 |
Necrosis
| n | missing | distinct | Info | Sum | Mean | Gmd |
|---|---|---|---|---|---|---|
| 544 | 0 | 2 | 0.743 | 245 | 0.4504 | 0.496 |
Tumor
| n | missing | distinct | Info | Sum | Mean | Gmd |
|---|---|---|---|---|---|---|
| 544 | 0 | 2 | 0.743 | 299 | 0.5496 | 0.496 |
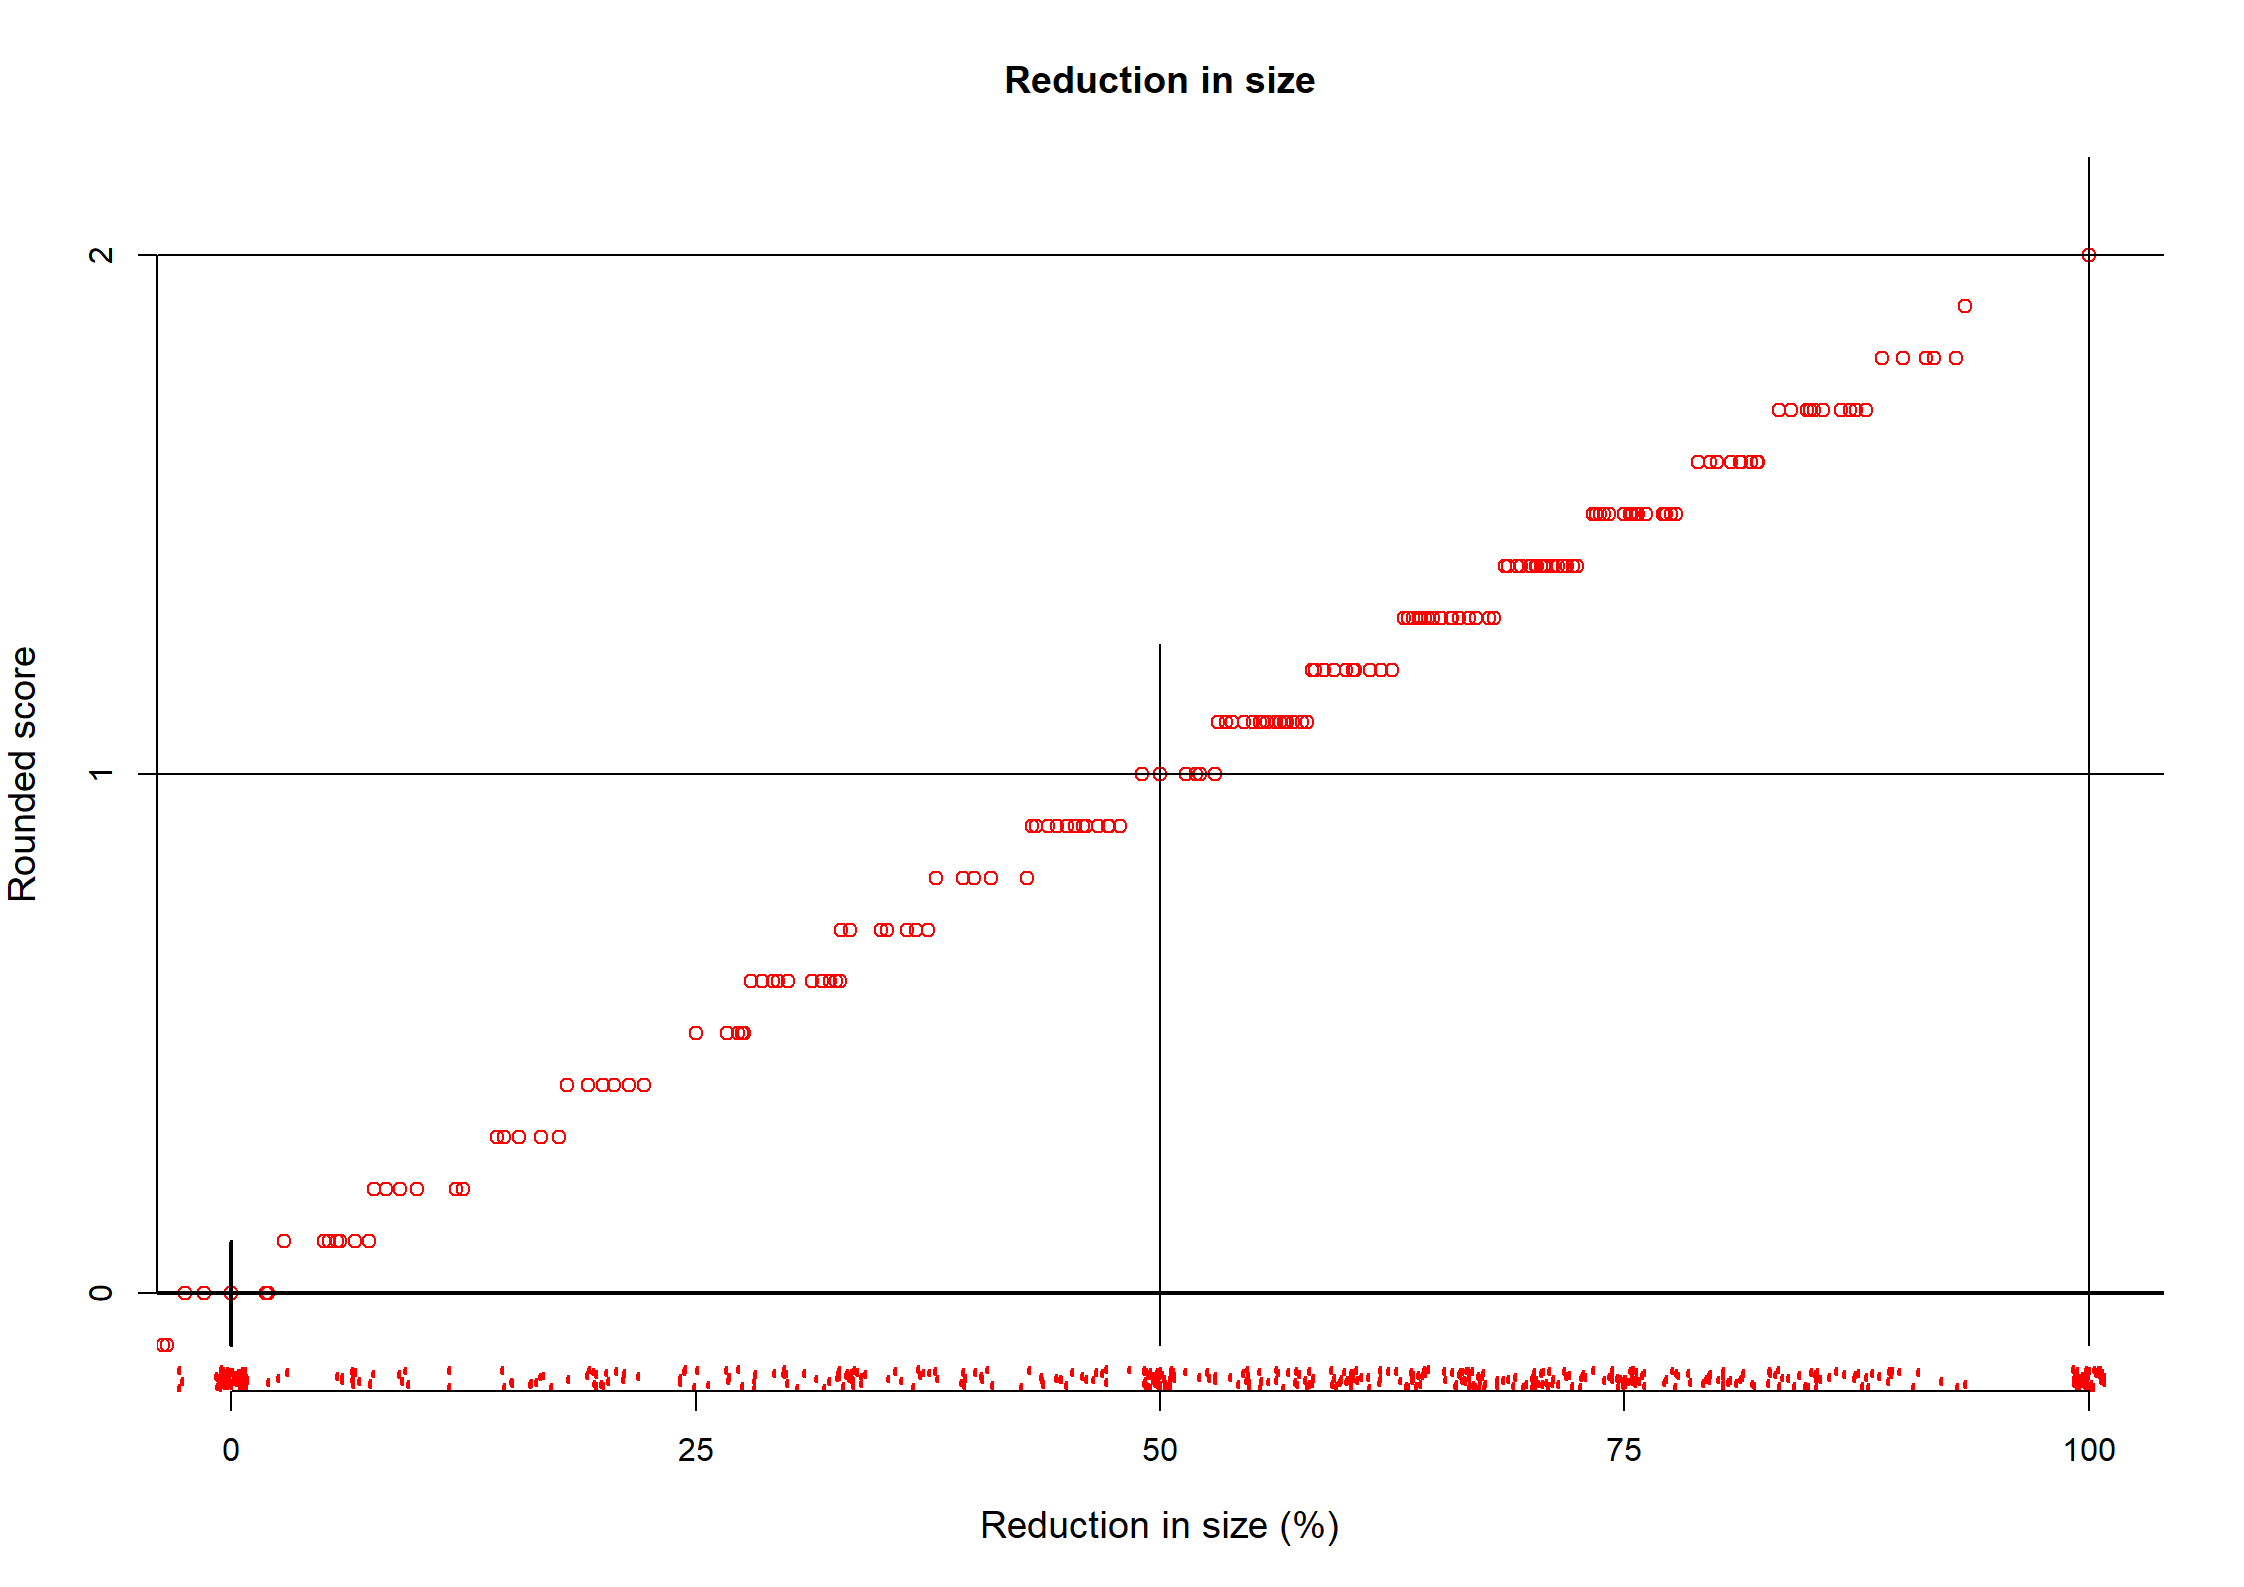
Reduction
| n | missing | distinct | Info | Mean | Gmd | .05 | .10 | .25 | .50 | .75 | .90 | .95 |
|---|---|---|---|---|---|---|---|---|---|---|---|---|
| 544 | 0 | 200 | 0.998 | 44.82 | 43.07 | -25.00 | 0.00 | 20.00 | 51.67 | 73.37 | 87.85 | 100.00 |
LDHst
| n | missing | distinct | Info | Mean | Gmd | .05 | .10 | .25 | .50 | .75 | .90 | .95 |
|---|---|---|---|---|---|---|---|---|---|---|---|---|
| 544 | 0 | 472 | 1 | 2.03 | 1.605 | 0.6789 | 0.7661 | 0.9679 | 1.3675 | 2.5317 | 3.8014 | 5.2242 |
Post.size
| n | missing | distinct | Info | Mean | Gmd | .05 | .10 | .25 | .50 | .75 | .90 | .95 |
|---|---|---|---|---|---|---|---|---|---|---|---|---|
| 544 | 0 | 93 | 0.996 | 33.26 | 33.37 | 2.00 | 5.00 | 10.00 | 20.00 | 44.25 | 93.50 | 100.00 |
Code show/hide
# Start the fitting of 3 models
set.seed(1)
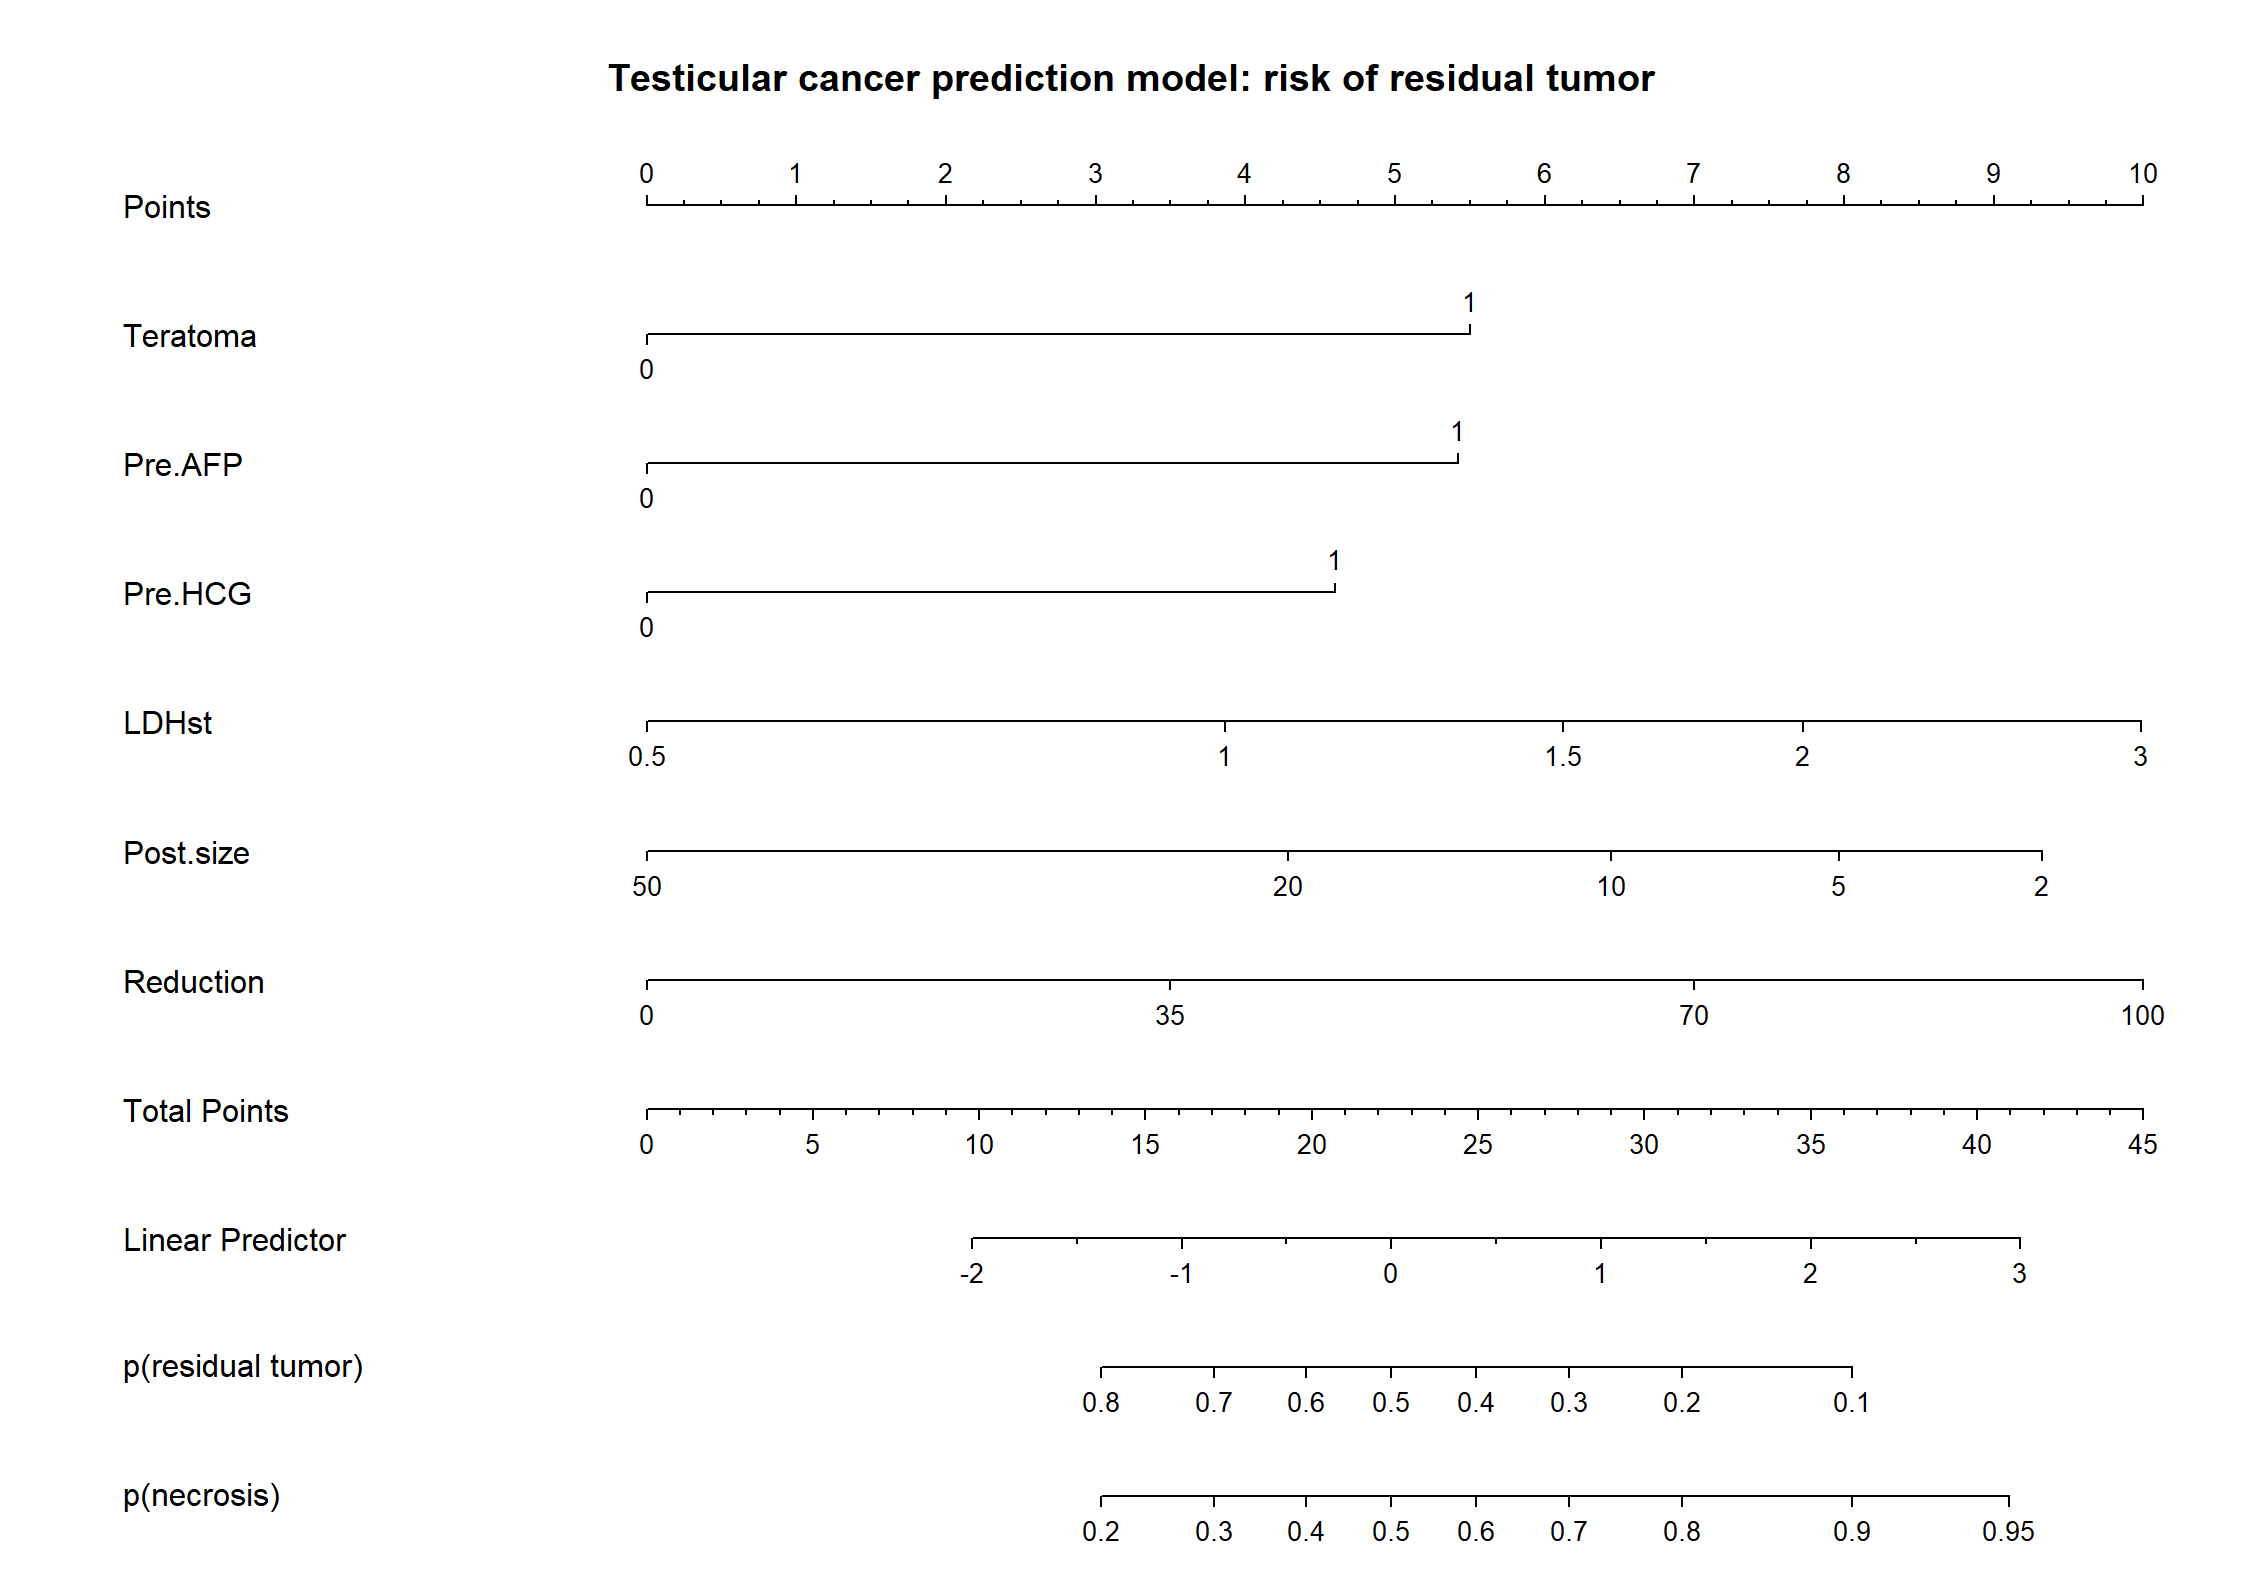
full <- lrm(Necrosis ~ Teratoma+Pre.AFP+Pre.HCG+log(LDHst)+sqrt(Post.size)+Reduction,
            data=n544,x=T,y=T,linear.predictors=T)
print(full)
Logistic Regression Model
lrm(formula = Necrosis ~ Teratoma + Pre.AFP + Pre.HCG + log(LDHst) +
    sqrt(Post.size) + Reduction, data = n544, x = T, y = T, linear.predictors = T)
| Model Likelihood Ratio Test |
Discrimination Indexes |
Rank Discrim. Indexes |
|
|---|---|---|---|
| Obs 544 | LR χ2 211.56 | R2 0.431 | C 0.839 |
| 0 299 | d.f. 6 | R26,544 0.315 | Dxy 0.677 |
| 1 245 | Pr(>χ2) <0.0001 | R26,404 0.399 | γ 0.678 |
| max |∂log L/∂β| 1×10⁻⁷ | Brier 0.163 | τa 0.336 |
| β | S.E. | Wald Z | Pr(>|Z|) | |
|---|---|---|---|---|
| Intercept | -1.0425 | 0.6086 | -1.71 | 0.0867 |
| Teratoma | 0.9094 | 0.2140 | 4.25 | <0.0001 |
| Pre.AFP | 0.9025 | 0.2333 | 3.87 | 0.0001 |
| Pre.HCG | 0.7827 | 0.2305 | 3.40 | 0.0007 |
| LDHst | 0.9854 | 0.2089 | 4.72 | <0.0001 |
| Post.size | -0.2915 | 0.0815 | -3.58 | 0.0003 |
| Reduction | 0.0158 | 0.0052 | 3.04 | 0.0024 |
