We note minor differences between the continuous fits, and a clear loss of information for the dichtomization at age 65 years
Code show/hide
anova(agegusto.linear)
                Wald Statistics          Response: DAY30

 Factor     Chi-Square d.f. P
 AGE        1728.89    1    <.0001
 TOTAL      1728.89    1    <.0001
Code show/hide
anova(agegusto.square)
                Wald Statistics          Response: DAY30

 Factor     Chi-Square d.f. P
 AGE        1858.27    2    <.0001
  Nonlinear   13.21    1    3e-04
 TOTAL      1858.27    2    <.0001
Code show/hide
anova(agegusto.rcs)
                Wald Statistics          Response: DAY30

 Factor     Chi-Square d.f. P
 AGE        1878.45    4    <.0001
  Nonlinear   24.71    3    <.0001
 TOTAL      1878.45    4    <.0001
Code show/hide
anova(agegusto.linearspline)
                Wald Statistics          Response: DAY30

 Factor     Chi-Square d.f. P
 AGE        1846.73    2    <.0001
 TOTAL      1846.73    2    <.0001
Code show/hide
anova(agegusto.cat65)
                Wald Statistics          Response: DAY30

 Factor     Chi-Square d.f. P
 AGE        1262.57    1    <.0001
 TOTAL      1262.57    1    <.0001
Plotting of age effects
Plot age effect first at lp scale (logodds), then at probability scale
Age effect at logodds scale; Age effect at probability scale
Fig 6.1
Start surgical mortality by age in Medicare
Age effect at logodds scale
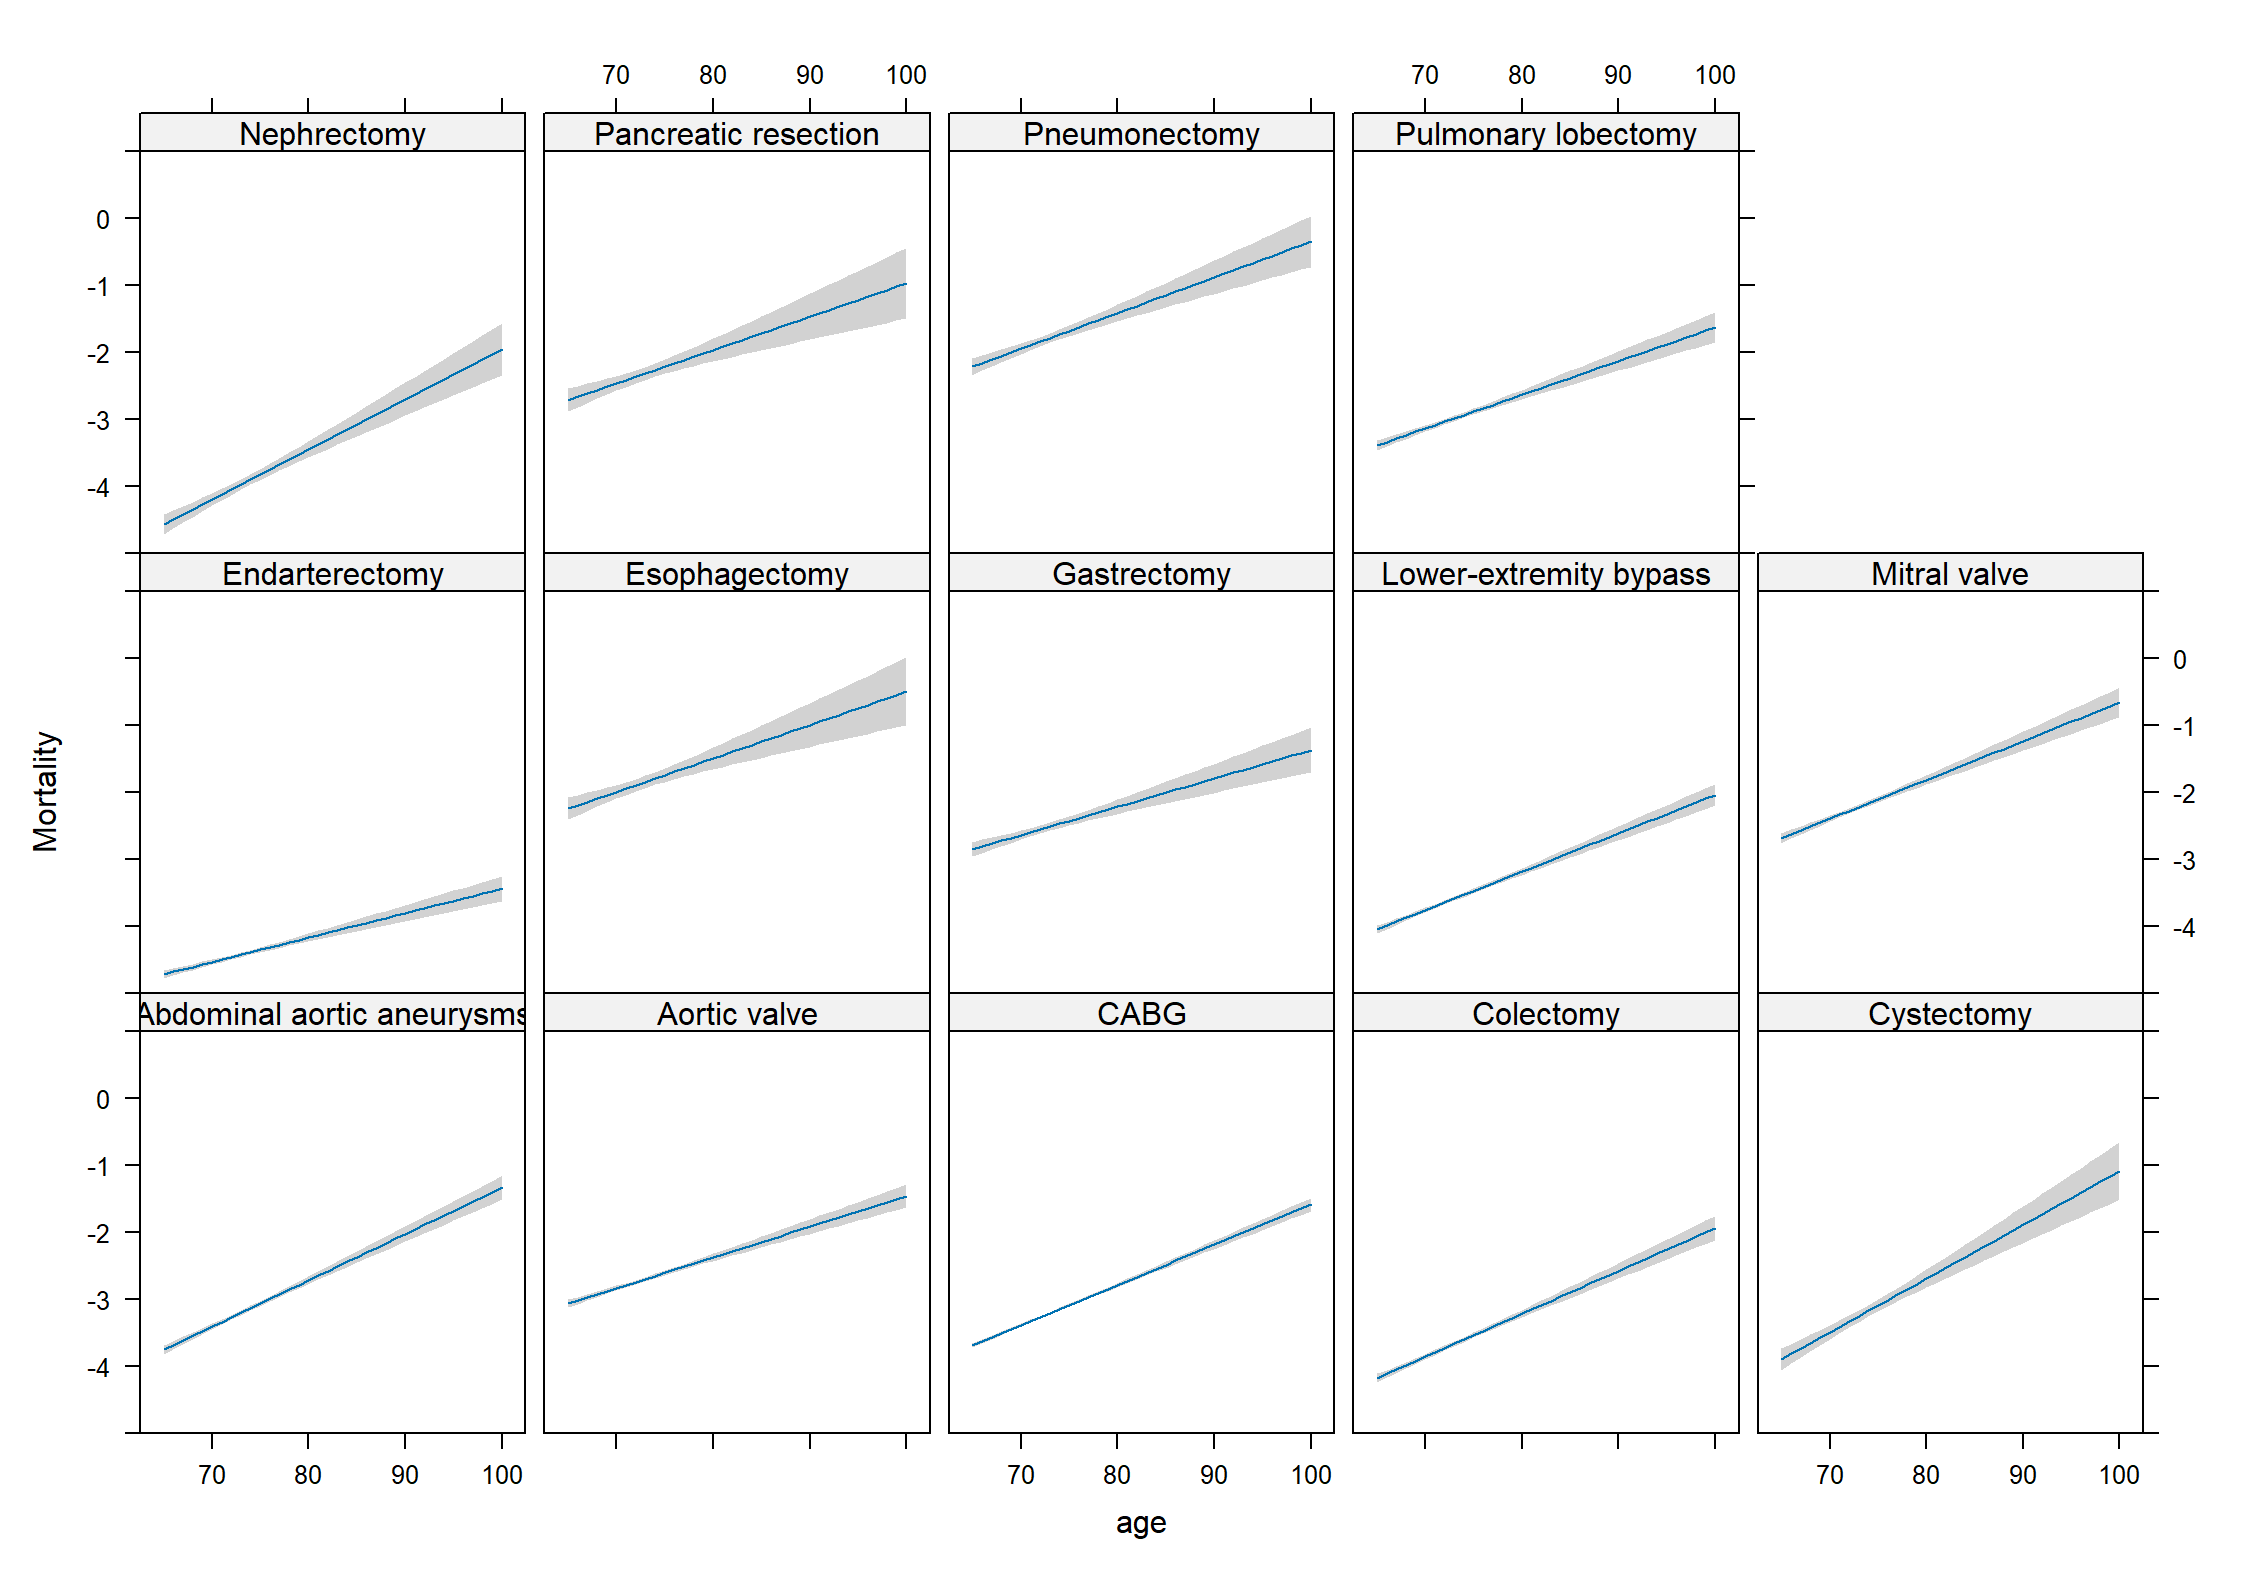
Anova results for the fit of age, with interaction by type of surgery
Type of surgery is clearly most relevant (chi2 >13500) in all fits. Age is als relevant (chi2>3000), and a square term is not needed (chi2 = 2); the interaction adds a little bit (chi2 95). With these large numbers (1.1M patients), most effects have p<.0001.
We will evaluate the differences between fits with or without interaction term graphically further down
Code show/hide
# Look for model improvementsanova(fitplot2) # linear age effect, no interaction with surgery
                Wald Statistics          Response: mort

 Factor     Chi-Square d.f. P
 surgery    13500.19   13   <.0001
 age         3167.14    1   <.0001
 TOTAL      16445.99   14   <.0001
Code show/hide
anova(fitage2) # age square added
                Wald Statistics          Response: mort

 Factor     Chi-Square d.f. P
 surgery    13499.66   13   <.0001
 age10         18.13    1   <.0001
 age102         2.33    1   0.127
 TOTAL      16424.97   15   <.0001
Code show/hide
anova(fitplot) # interaction added to linear age effect
                Wald Statistics          Response: mort

 Factor                                       Chi-Square d.f. P
 surgery  (Factor+Higher Order Factors)       13566.02   26   <.0001
  All Interactions                               94.55   13   <.0001
 age  (Factor+Higher Order Factors)            3280.66   14   <.0001
  All Interactions                               94.55   13   <.0001
 surgery * age  (Factor+Higher Order Factors)    94.55   13   <.0001
 TOTAL                                        16620.27   27   <.0001
Plotting of predicted age effects, with interaction by type of surgery; add 95% CI
Plot age effects at logodds scale with 95% CI
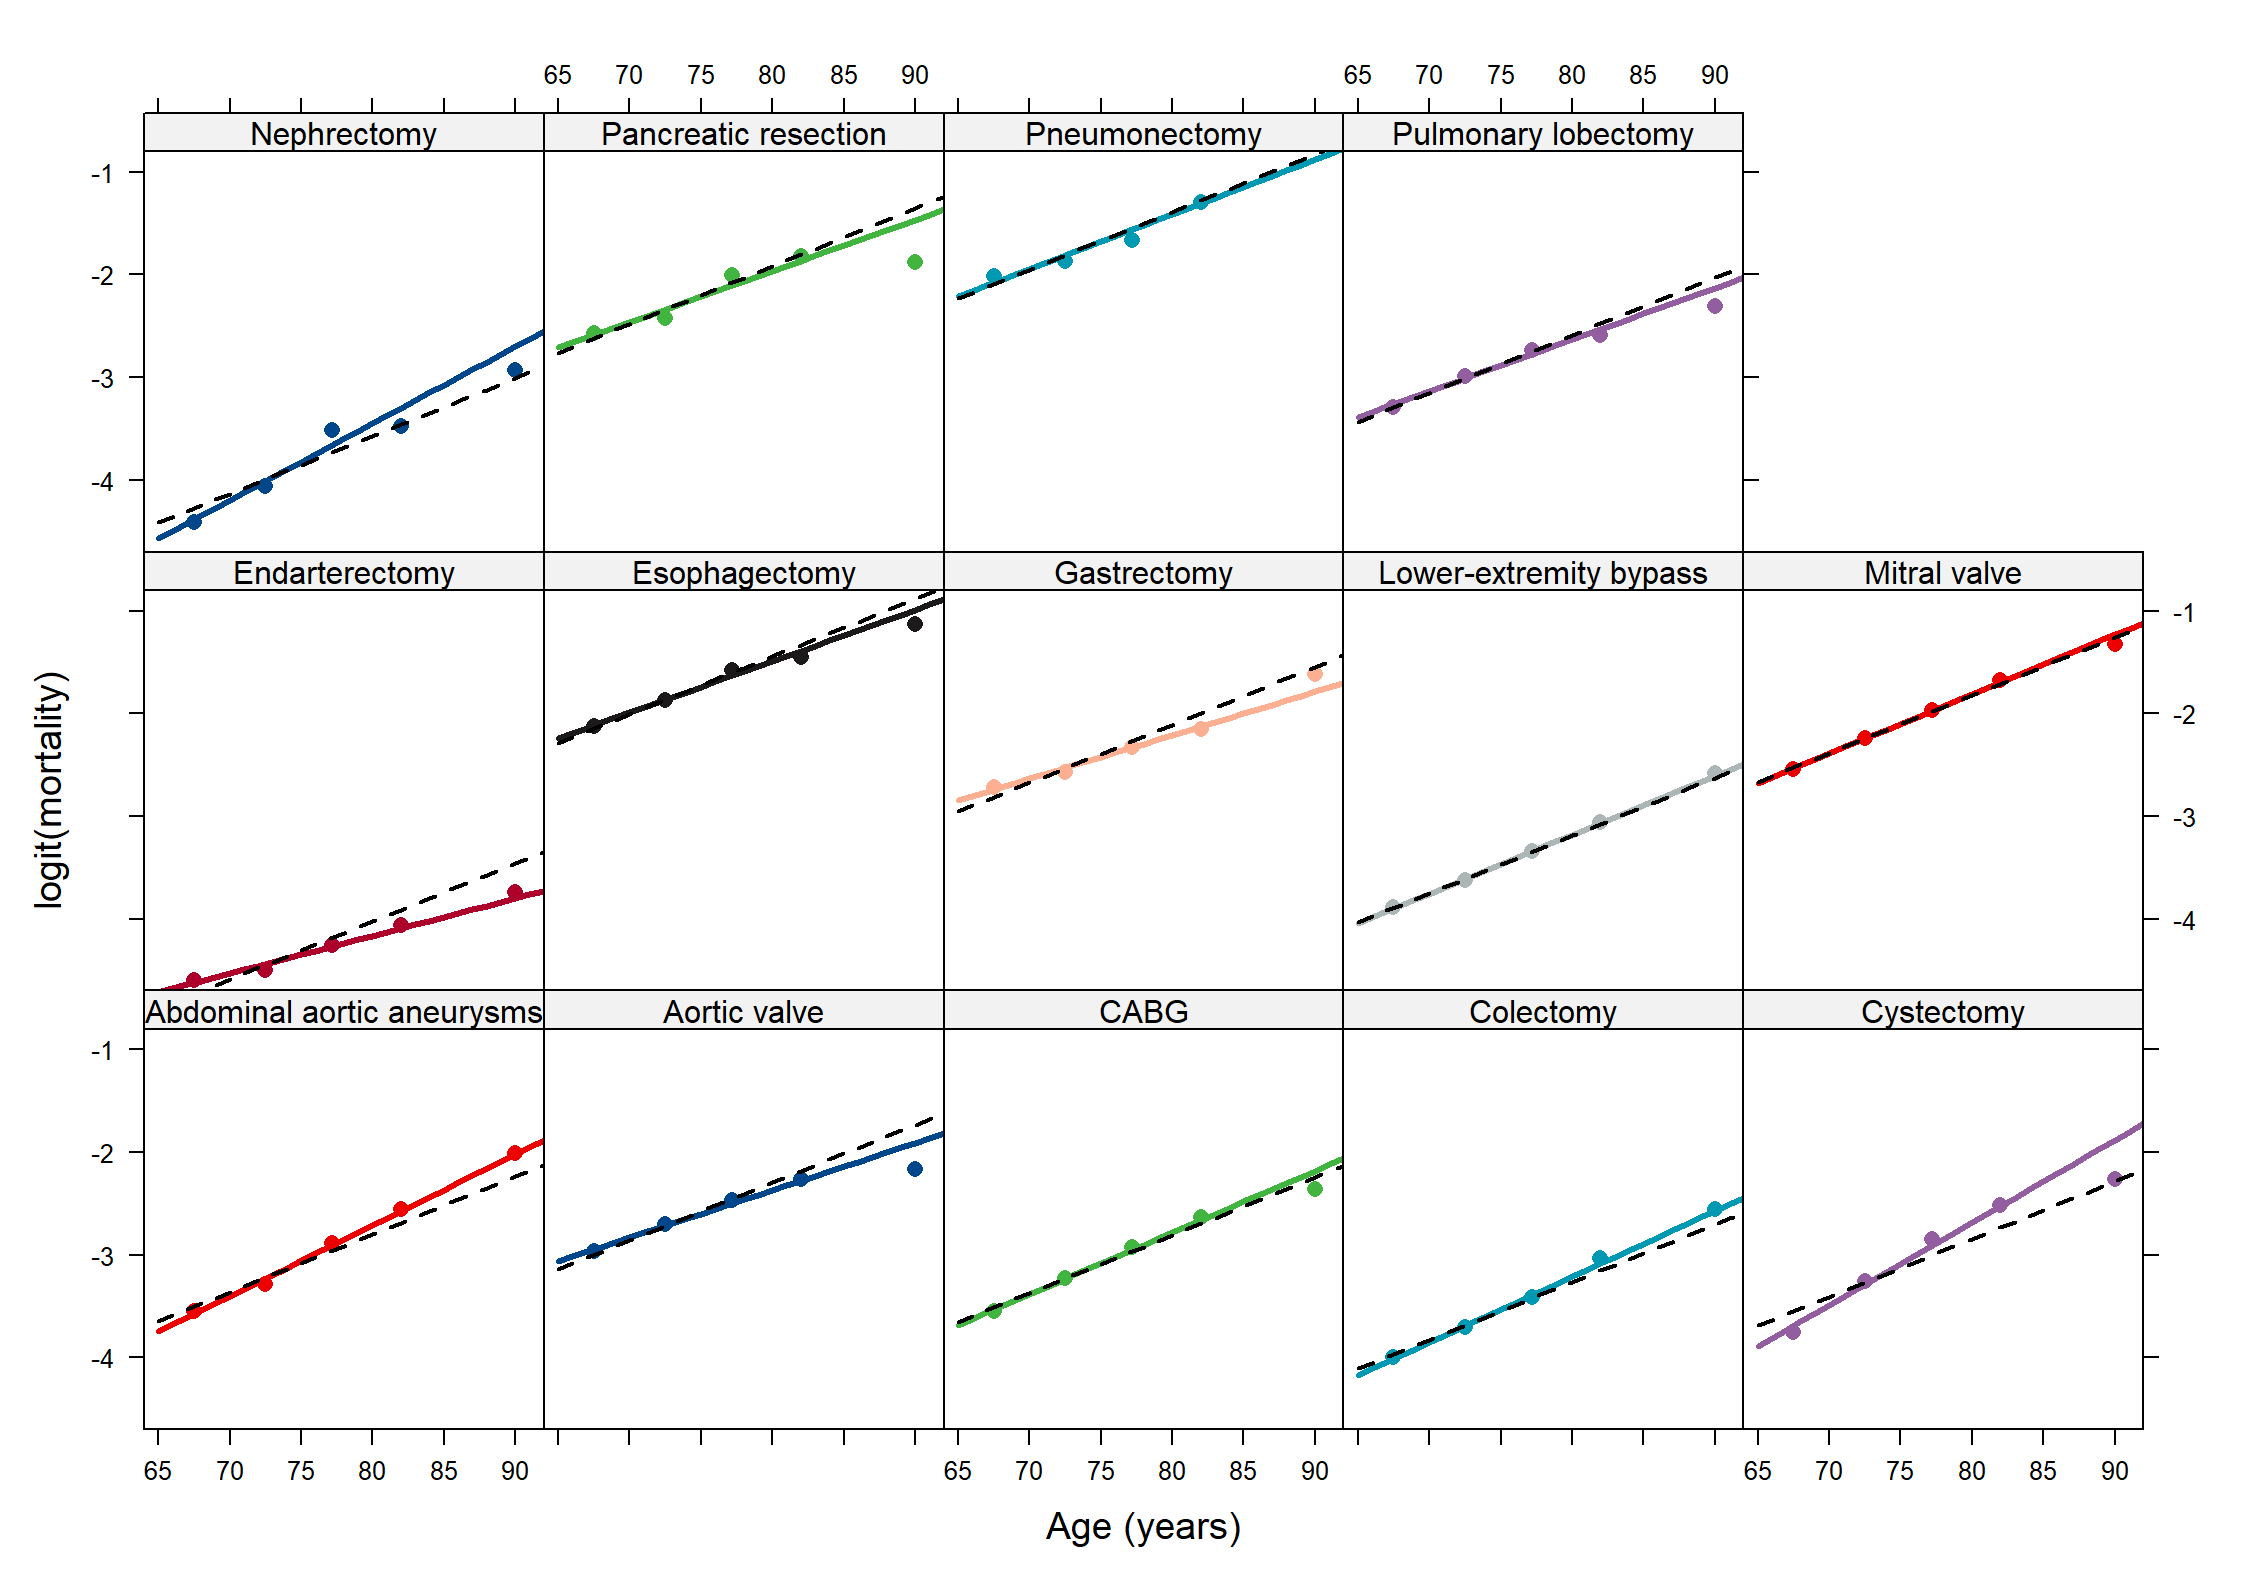
Plotting of age effects with original data points
Fit with interaction (solid lines) and no interaction (dashed lines)